Exploratory data analysis using visualization & Data organization in spreadsheets
CVEN 5999 - Summer 2025
Other sources for help
- Posit Community Forum: https://forum.posit.co/
- Documentation websites: https://dplyr.tidyverse.org/
- bsky community: https://bsky.app/hashtag/RStats

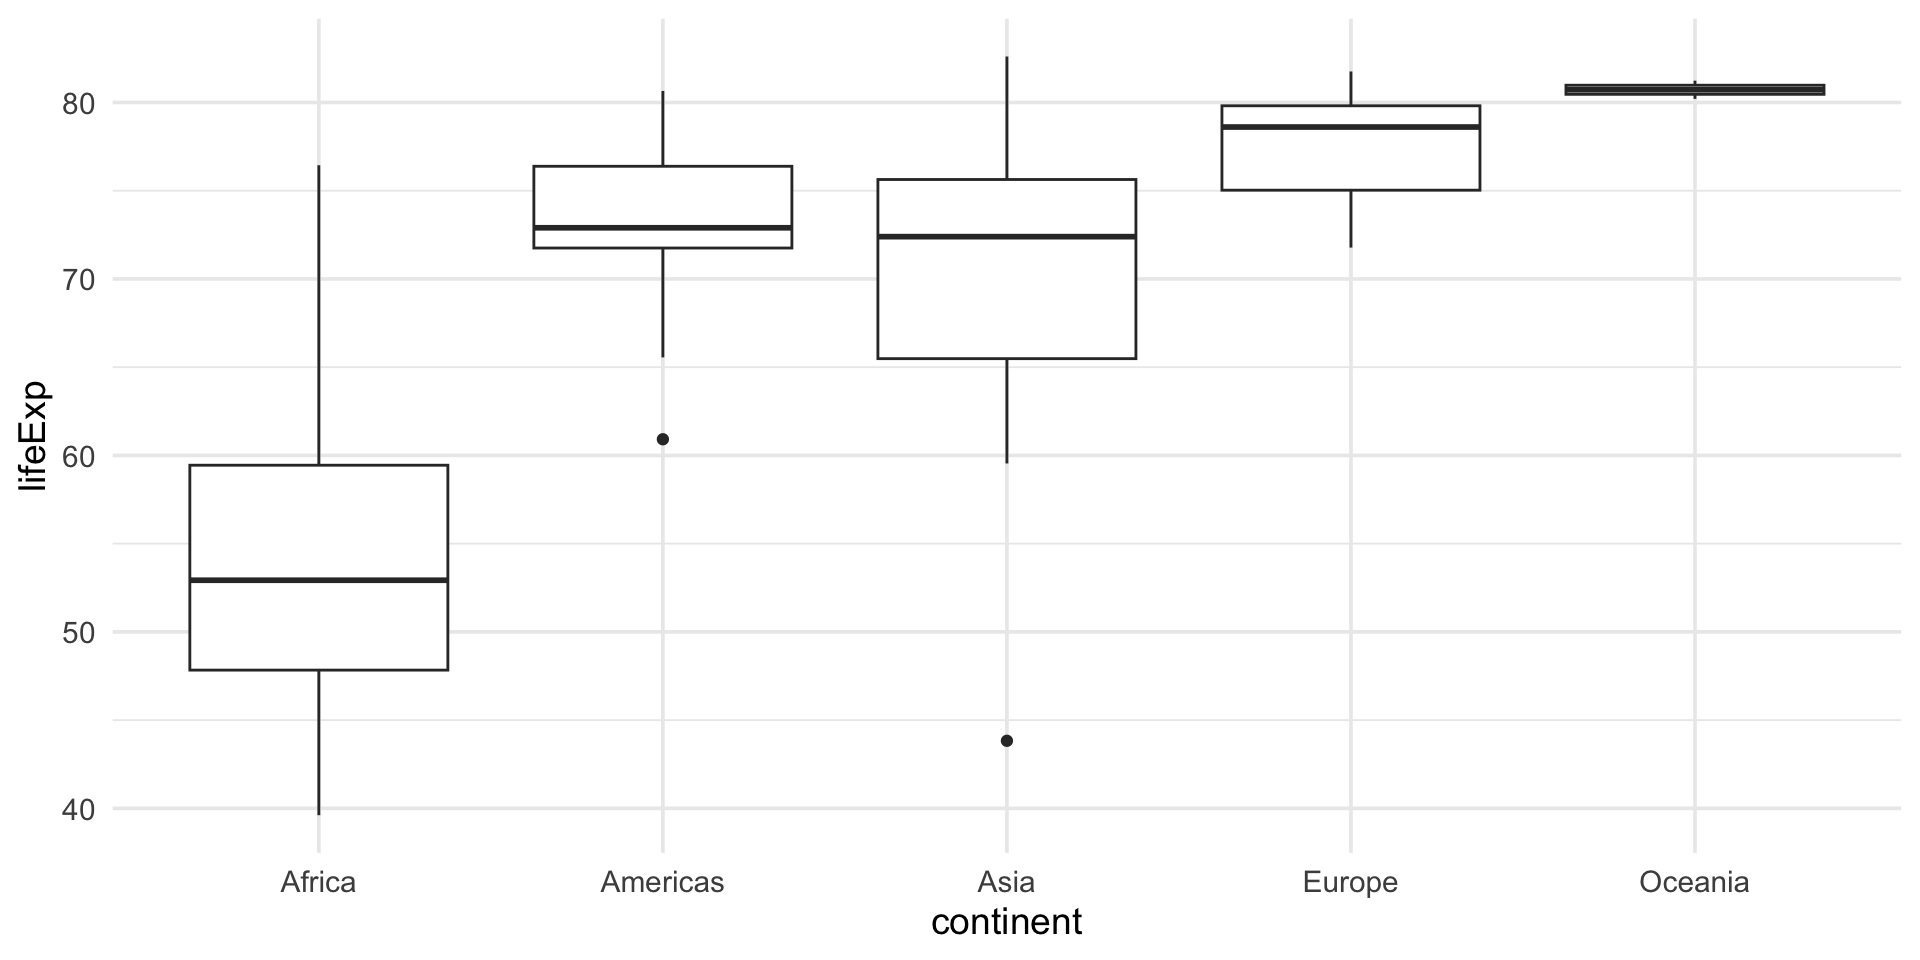
R Package ggplot2
- ggplot2 is tidyverse’s data visualization package
gginggplot2stands for Grammar of Graphics- Inspired by the book Grammar of Graphics by Leland Wilkinson
- Documentation: https://ggplot2.tidyverse.org/
- Book: https://ggplot2-book.org
Code structure

Code structure

Code structure

Code structure
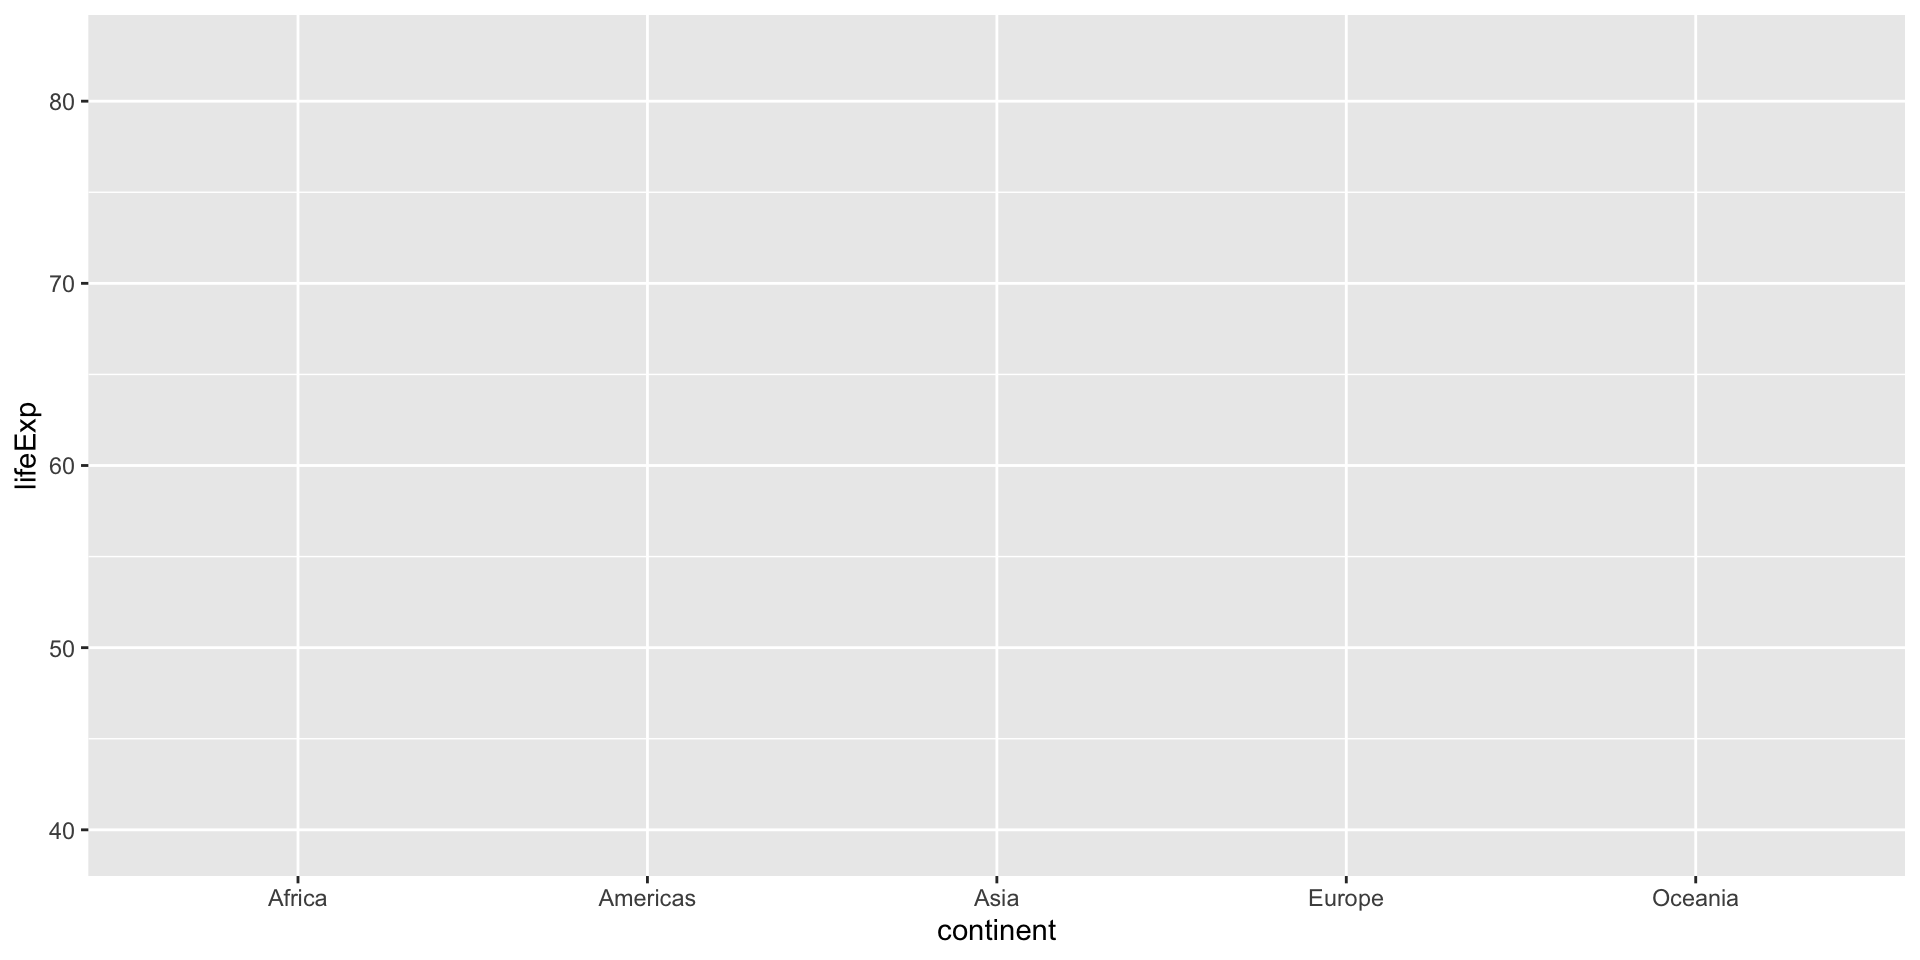
Code structure
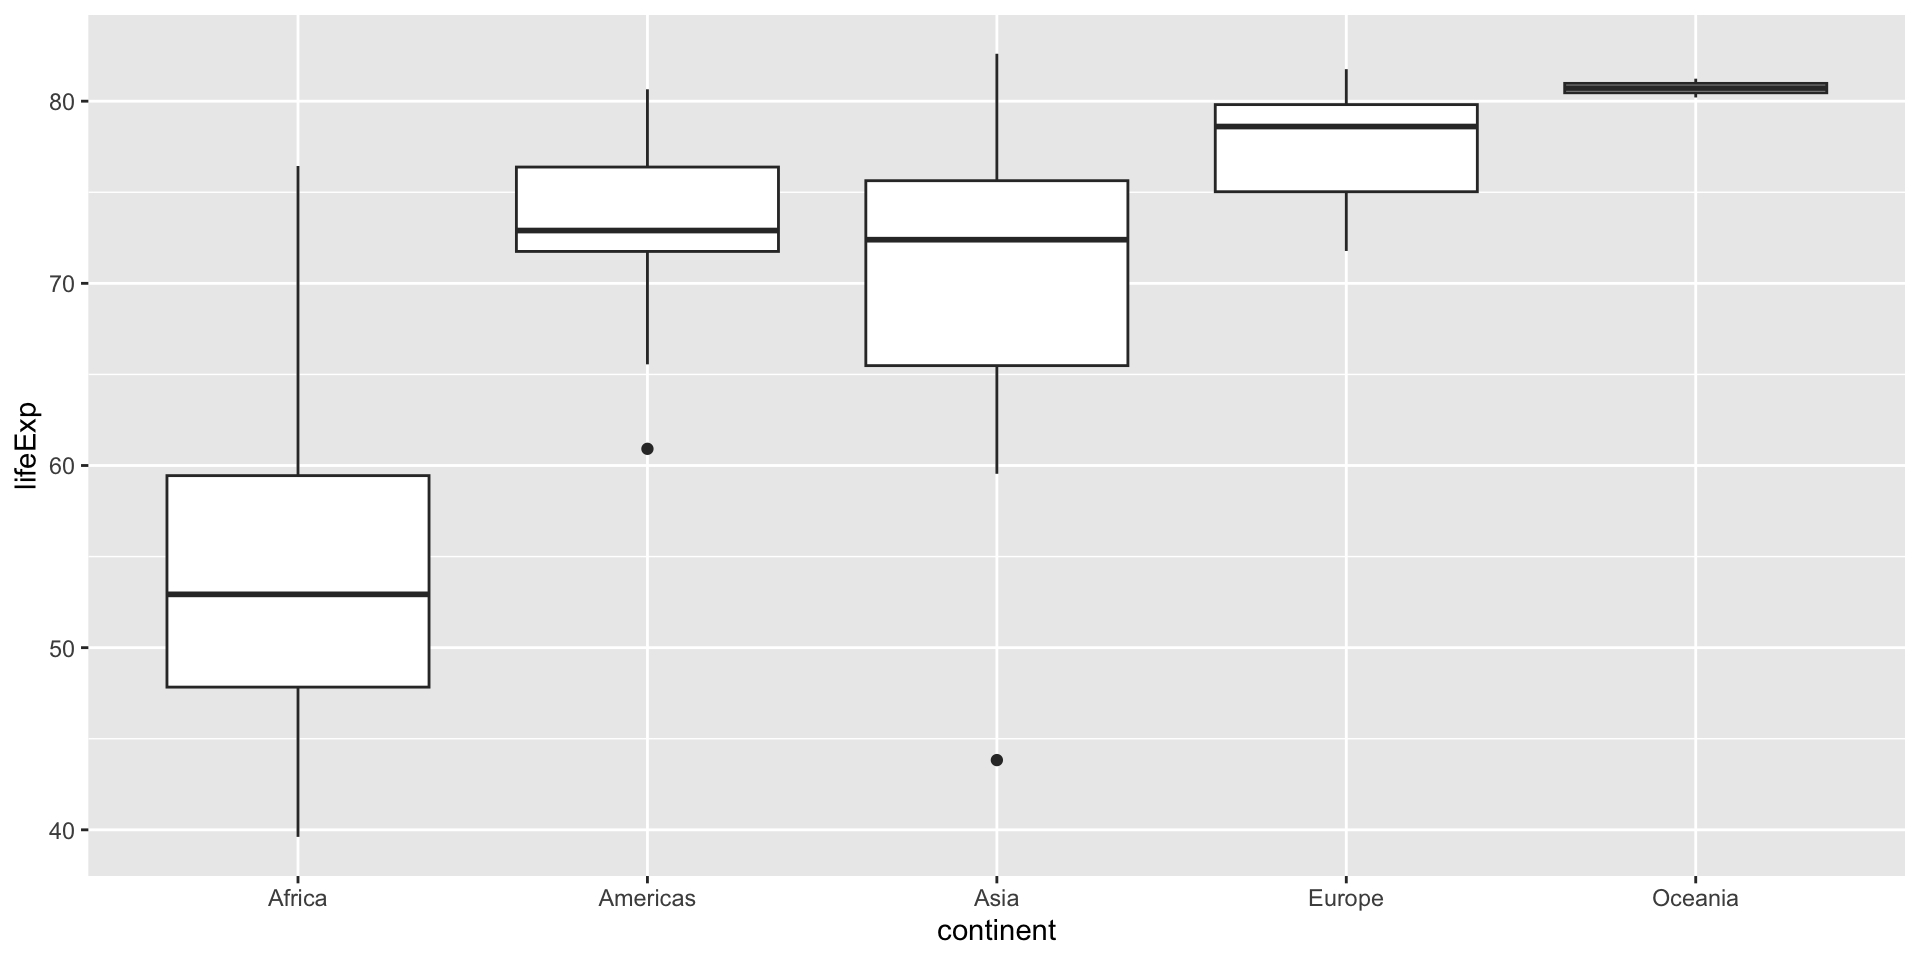
Code structure
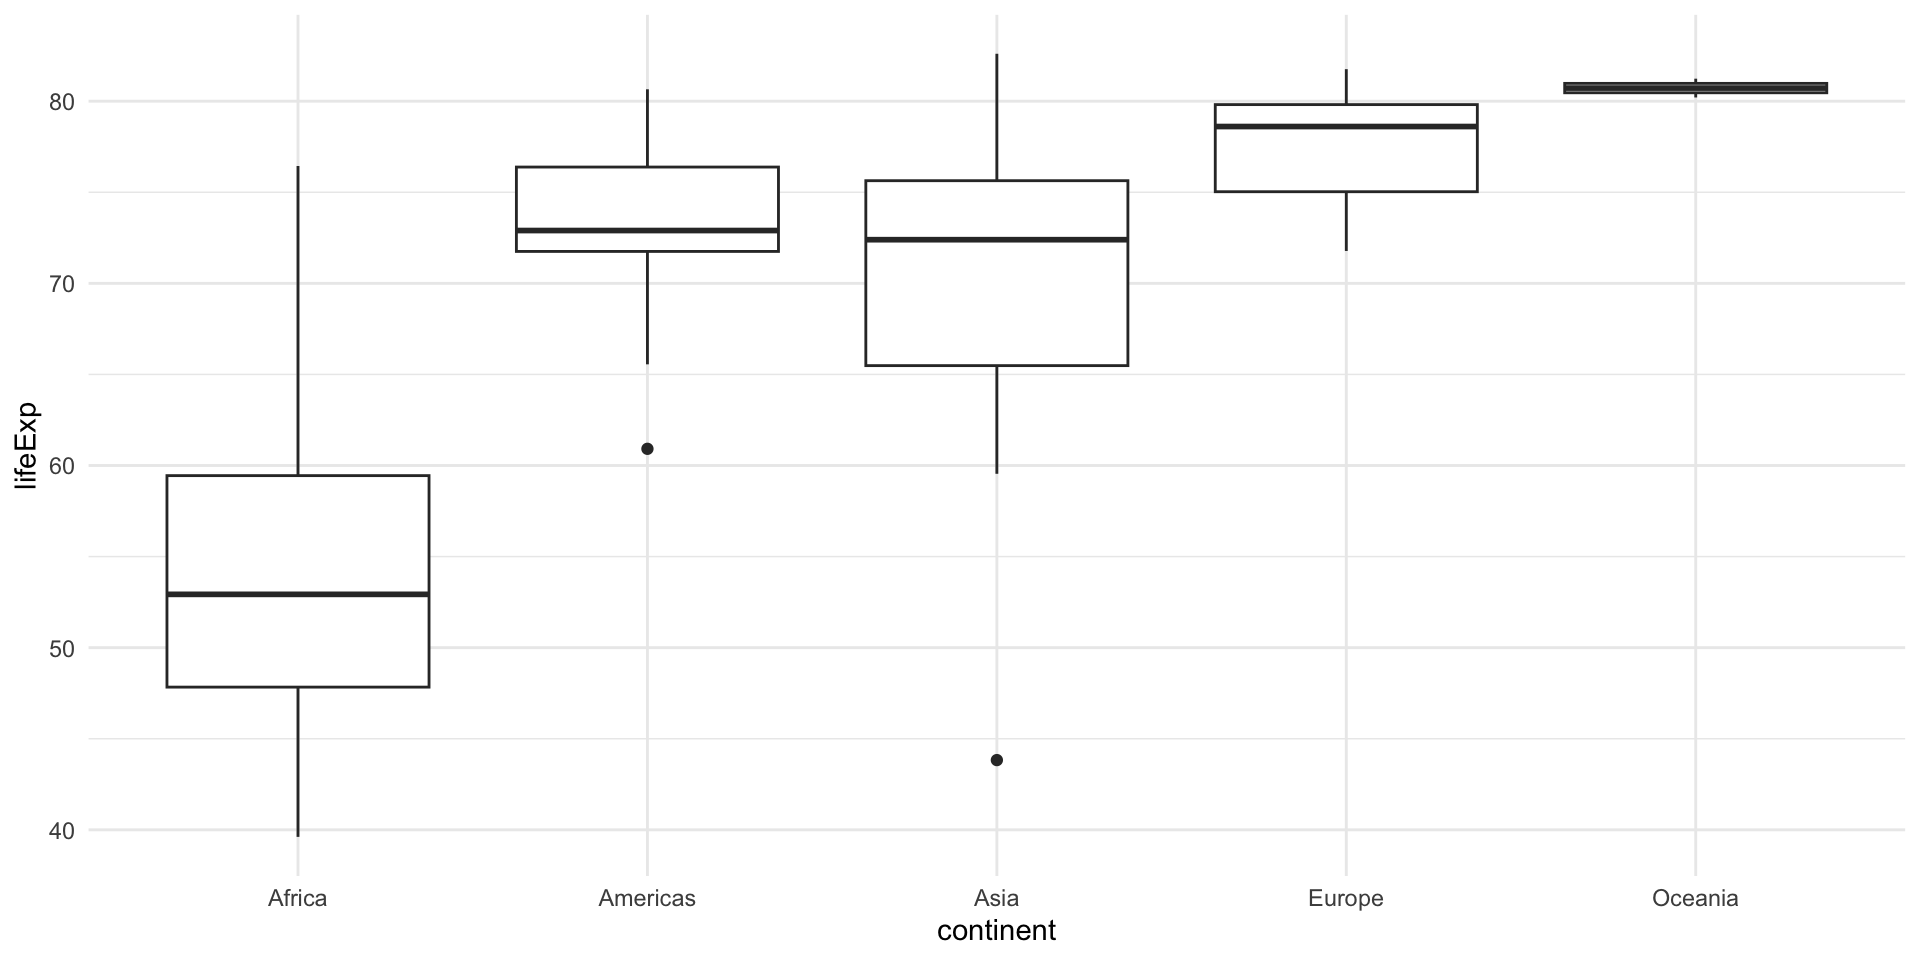
Code structure
Break

10:00
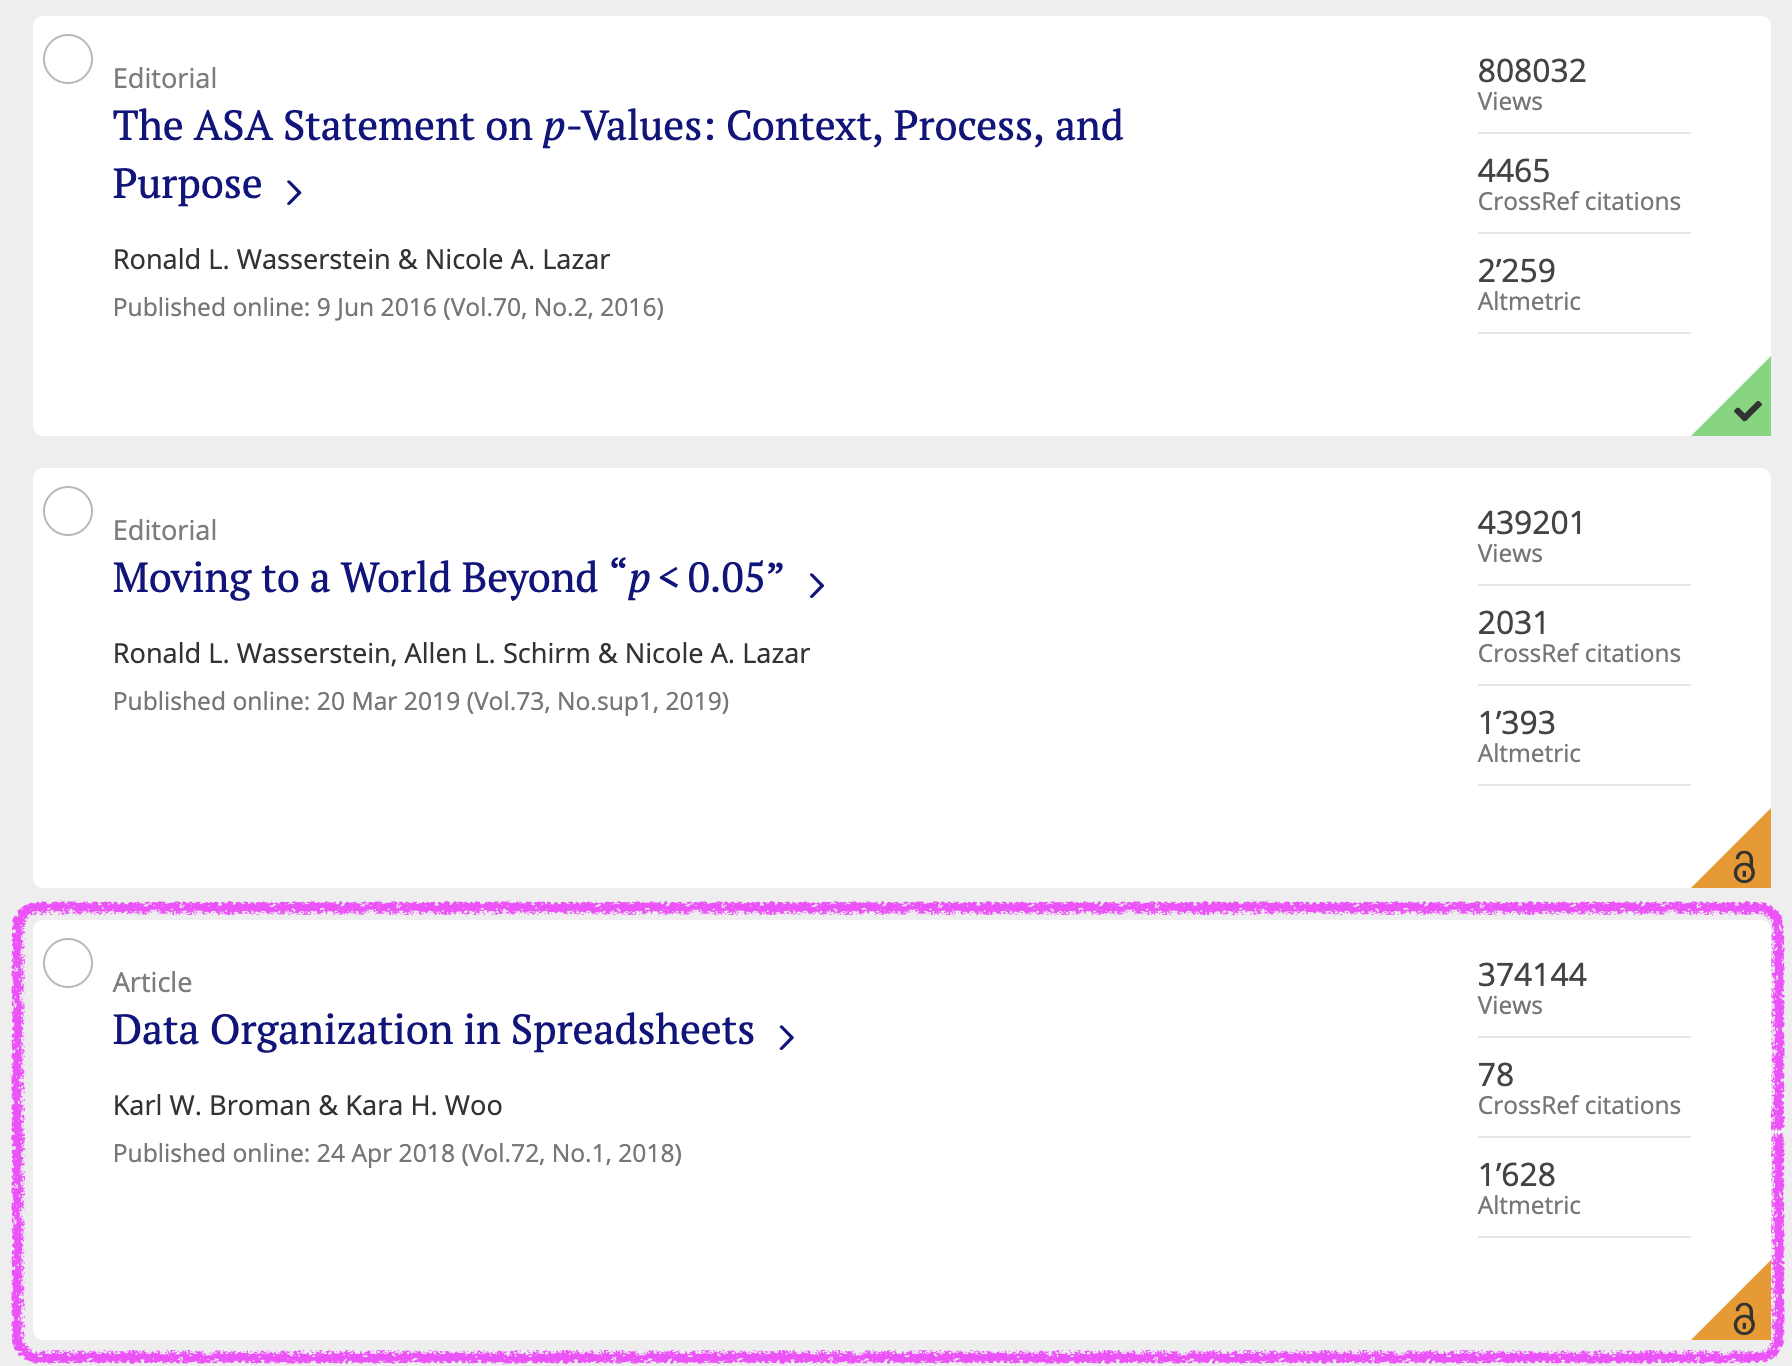
Data Organisation in Spreadsheets
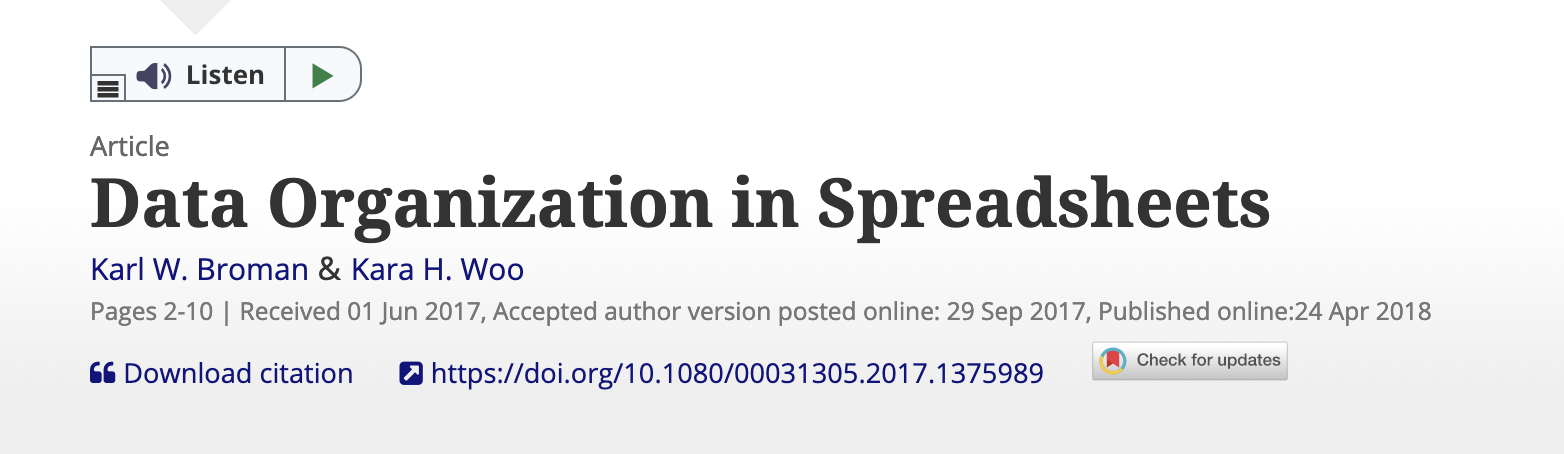
Why?
Because it will make your life easier!
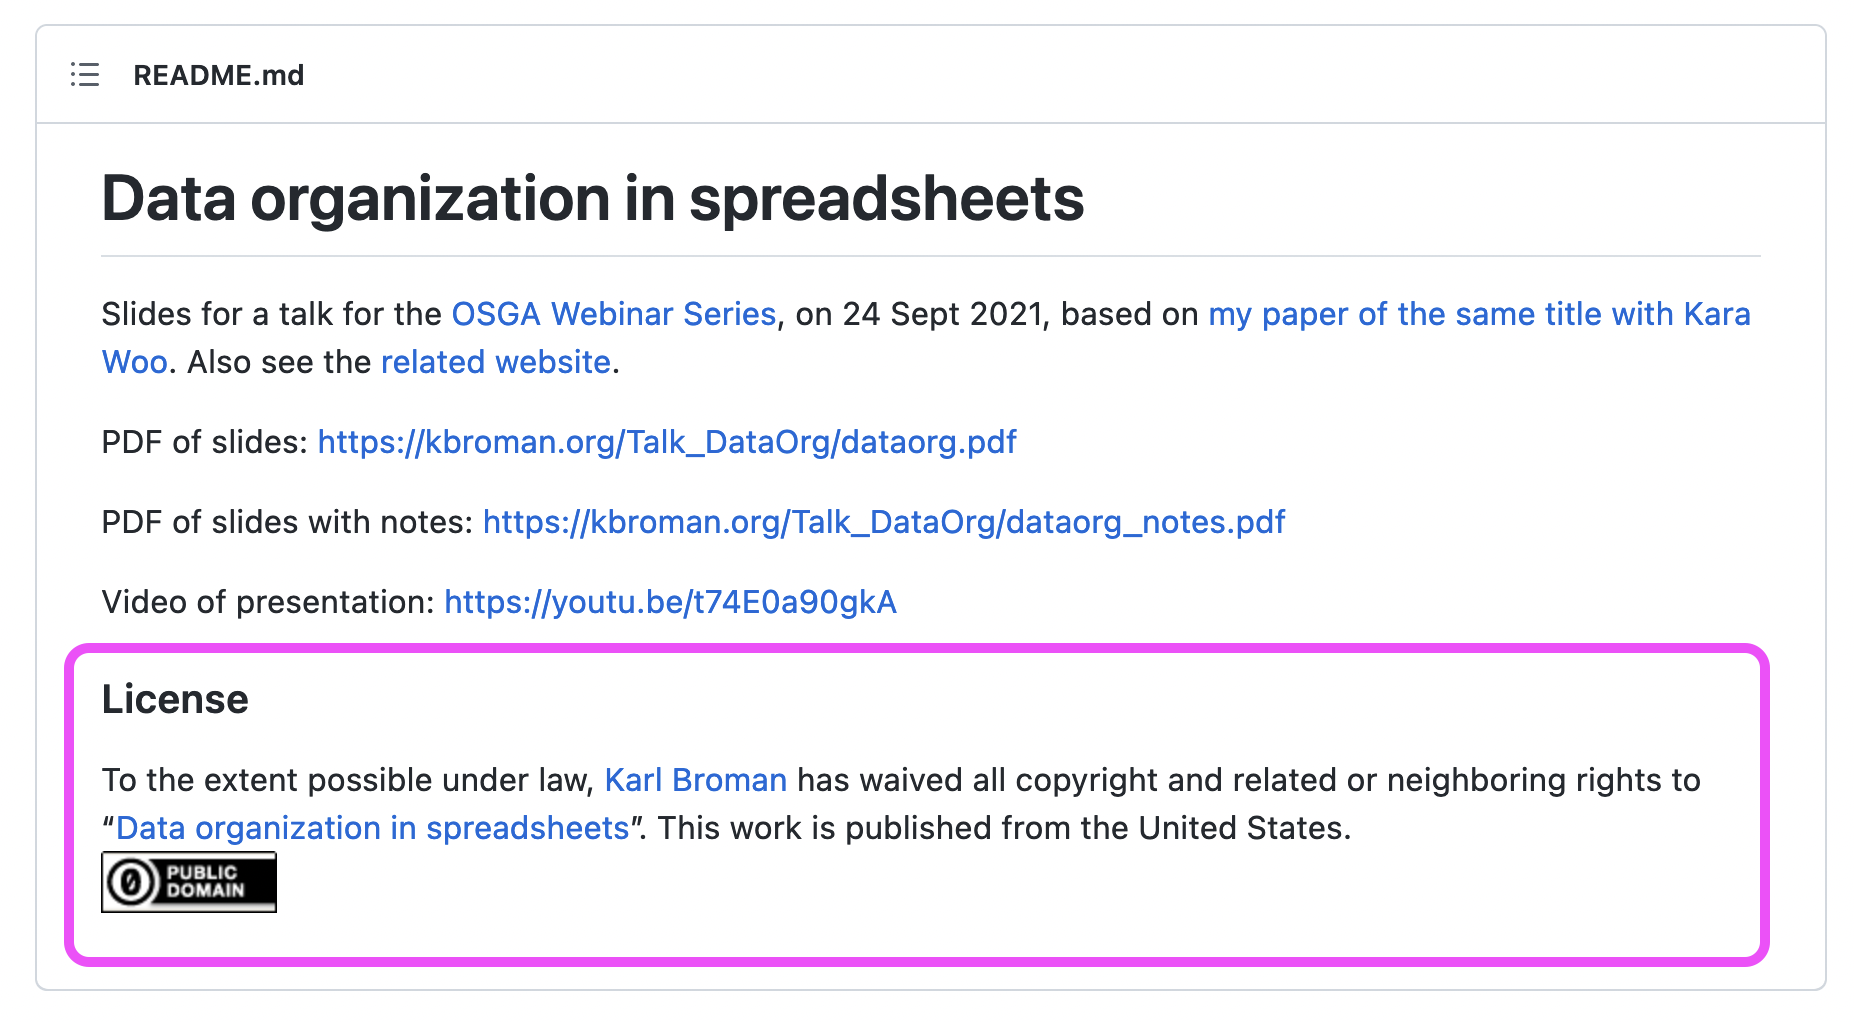
License? CC0 (!)
Slides created via revealjs and Quarto: https://quarto.org/docs/presentations/revealjs/
Access slides as PDF on GitHub
All material is licensed under Creative Commons Attribution Share Alike 4.0 International.
![]()